

Inventory
According to the National Association of Realtors (NAR) listing inventory remains historically low and August is supposed to be the peak month. NAR shows continuous dropping inventory since the financial crisis of 2008. Strangely, Manhattan is the opposite. Inventory for August should be the seasonal low in Manhattan but they have not been experiencing the same consistent decline in inventory as the rest of us. Instead, Manhattan inventory levels have been recovering since the low of 2013.
New Canaan inventory levels remained constant for most of the 20 years before the current crisis hovering around 150 homes on the market. The 2018 graph shows the period of excessive inventory peaking at 450 just as the 2023 graph shows the opposite, 60 to 90 houses.
The first chart, national listings, shows a continuous decrease from 3.5 million in 2008 to only 1 million listings in 2023. This has been a steady decline for 15 years. How does it affect New Canaan? We are all considering our options all the time. When some markets were cheap. The second chart, Manhattan, shows the opposite. With the exception of 2020 we have seen the number of listings double over the last decade, from 3,500 in 2013 to nearly 7,000 today.
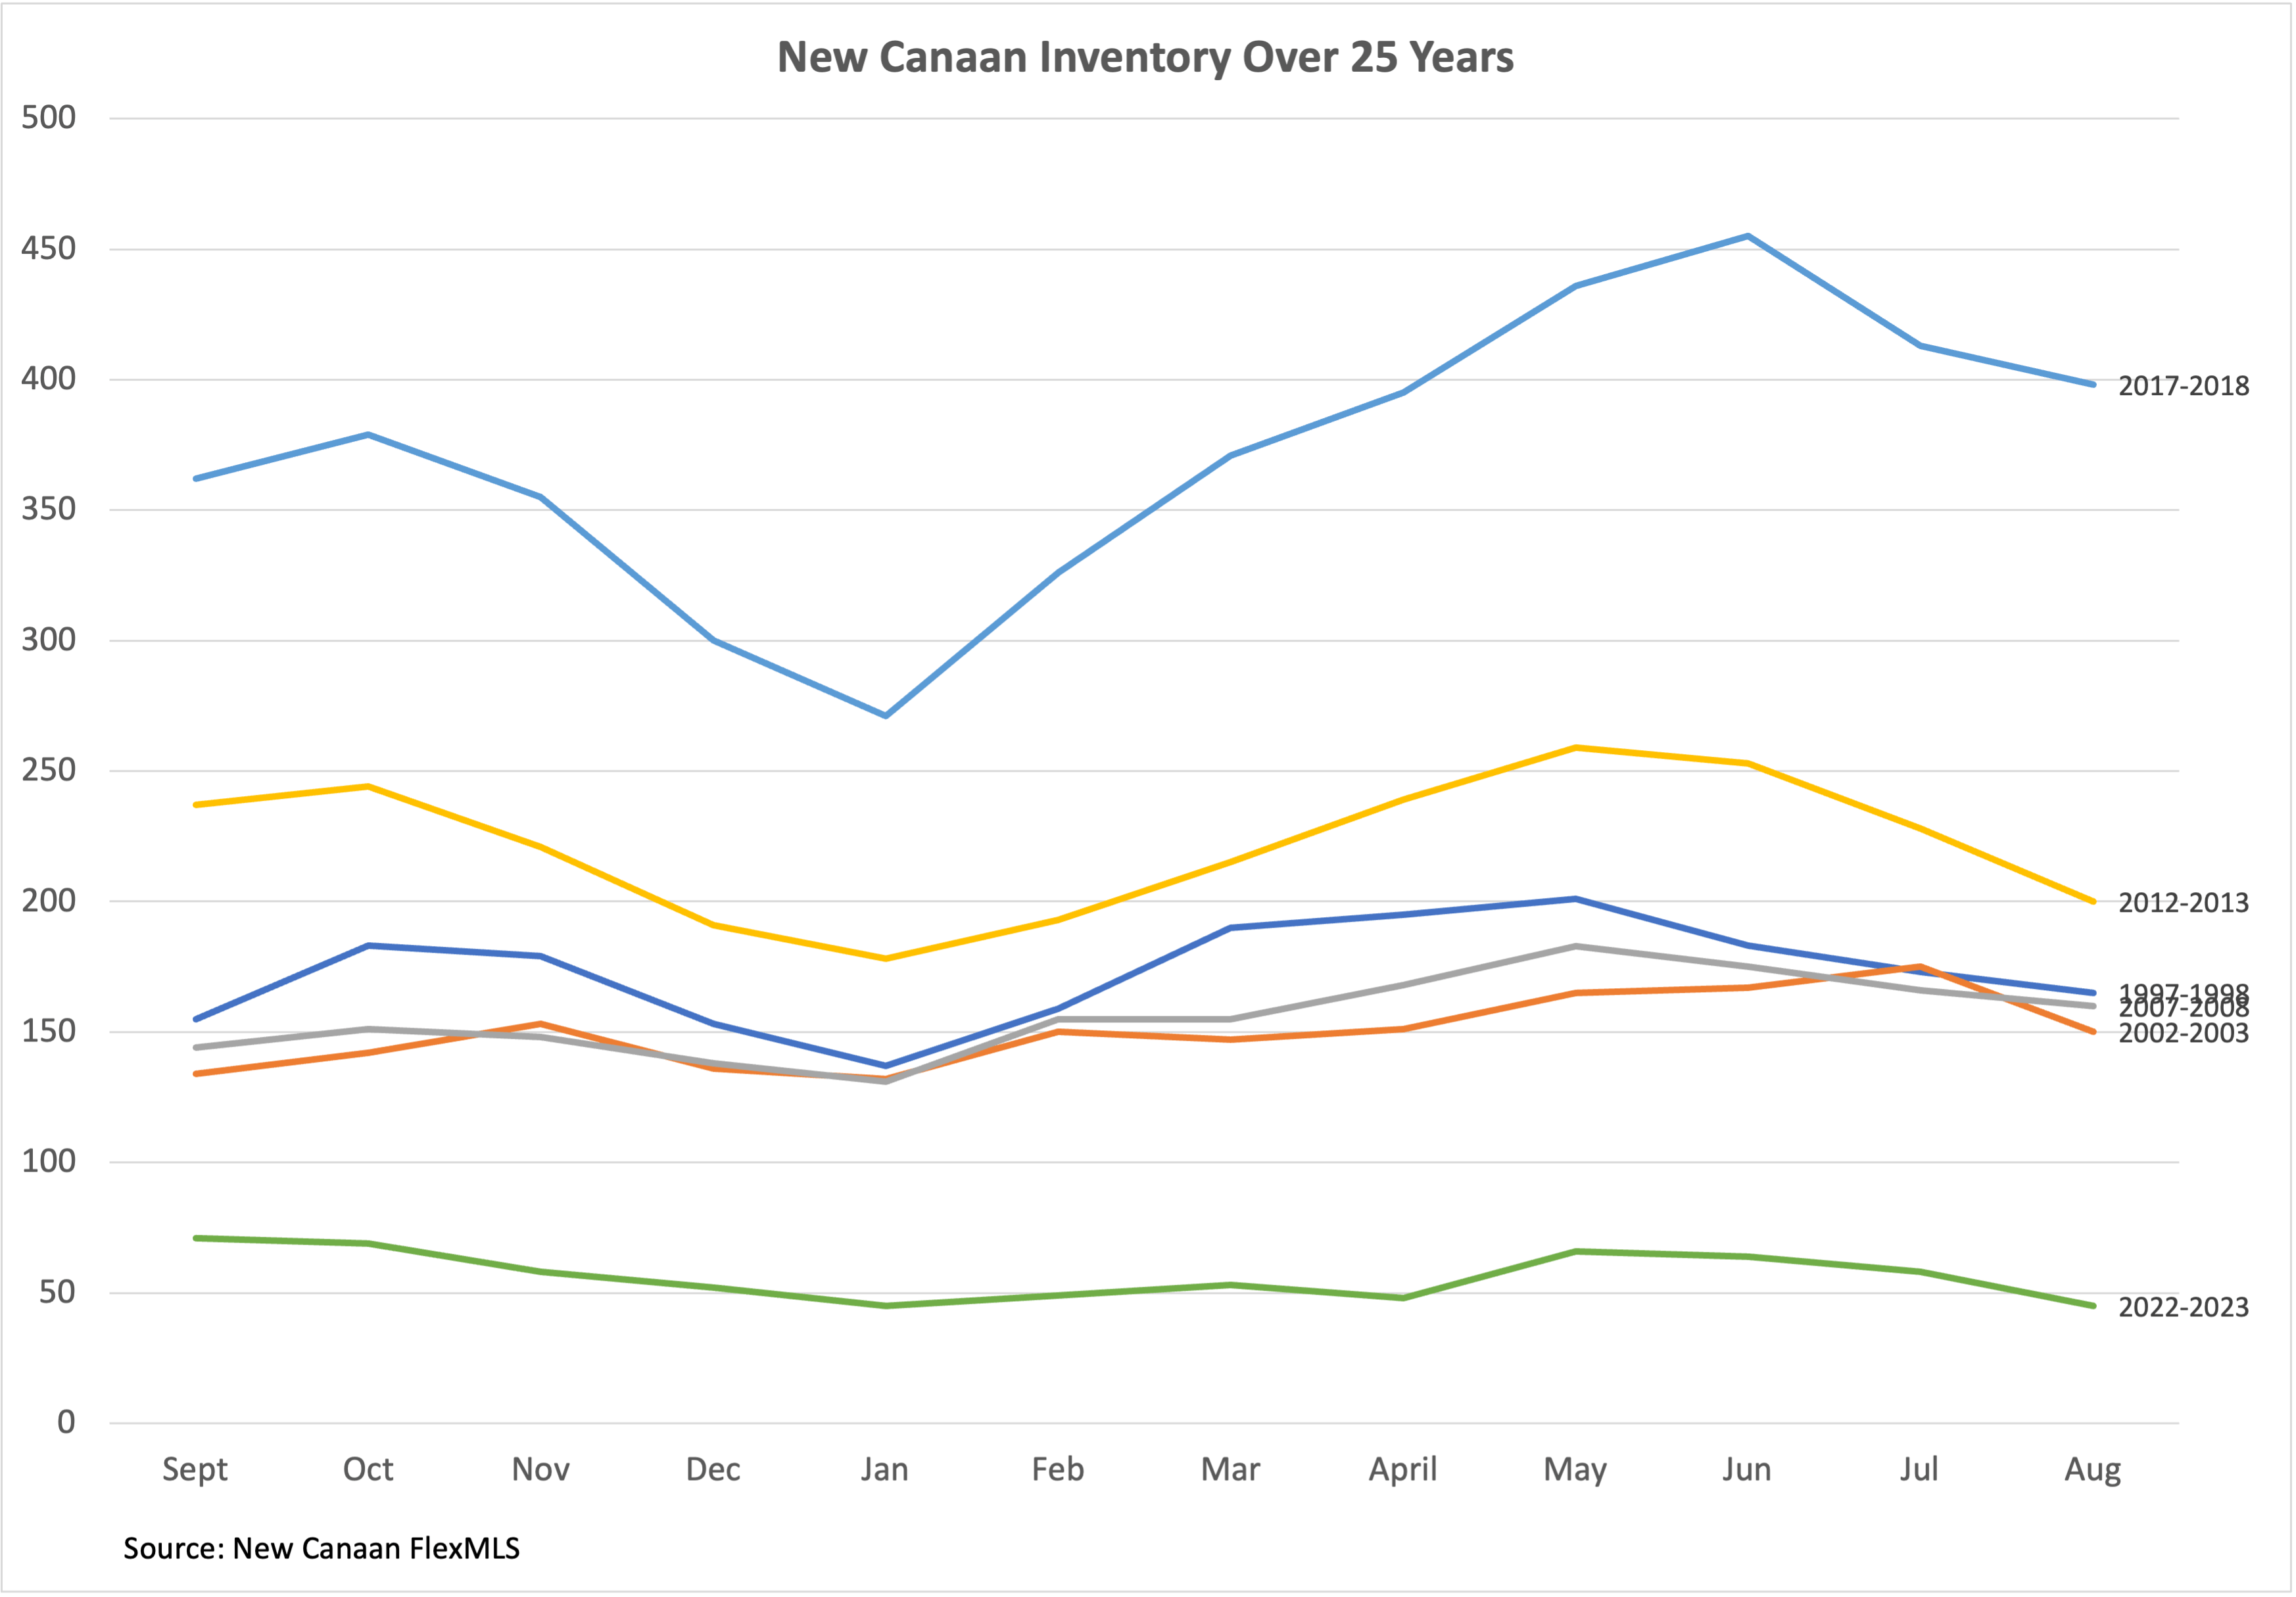
Here in New Canaan the pattern is mirroring the national trend, not that of Manhattan, with a steady decline in active listings since 2018. I looked back further than 2018 using (more accurate) New Canaan MLS data. Comparing the charts for August 2003, 2008, 2013, and 2018 in New Canaan show that inventory levels remained constant for most of the 20 years before the current crisis hovering around 150 homes on the market. The 2018 graph shows the period of excessive inventory peaking at 450 just as the 2023 graph shows the opposite, 60 to 90 houses.
The macroeconomic causes for our current lack of inventory are well documented: interest rate changes result in sellers waiting, combined with demographic data showing there are simply more buyers, and finally government stimulus related to the pandemic provided liquidity. Expect continued low inventory this Spring, probably at close to the current levels of 70.
Sales Volume
Compared to prior Augusts sales fell in every region of the country, particularly in the Northeast and in the West where the decline is double that, -35% of the Midwest or South, still down only -15%. In New Canaan in August we sold $66 million of single family homes, 28 sales. Dollar volume in New Canaan has risen each month since January but August is typically the top of the curve. Expect dollar volume and the number of sales to decline between August and February 1 before picking back up.
Rates
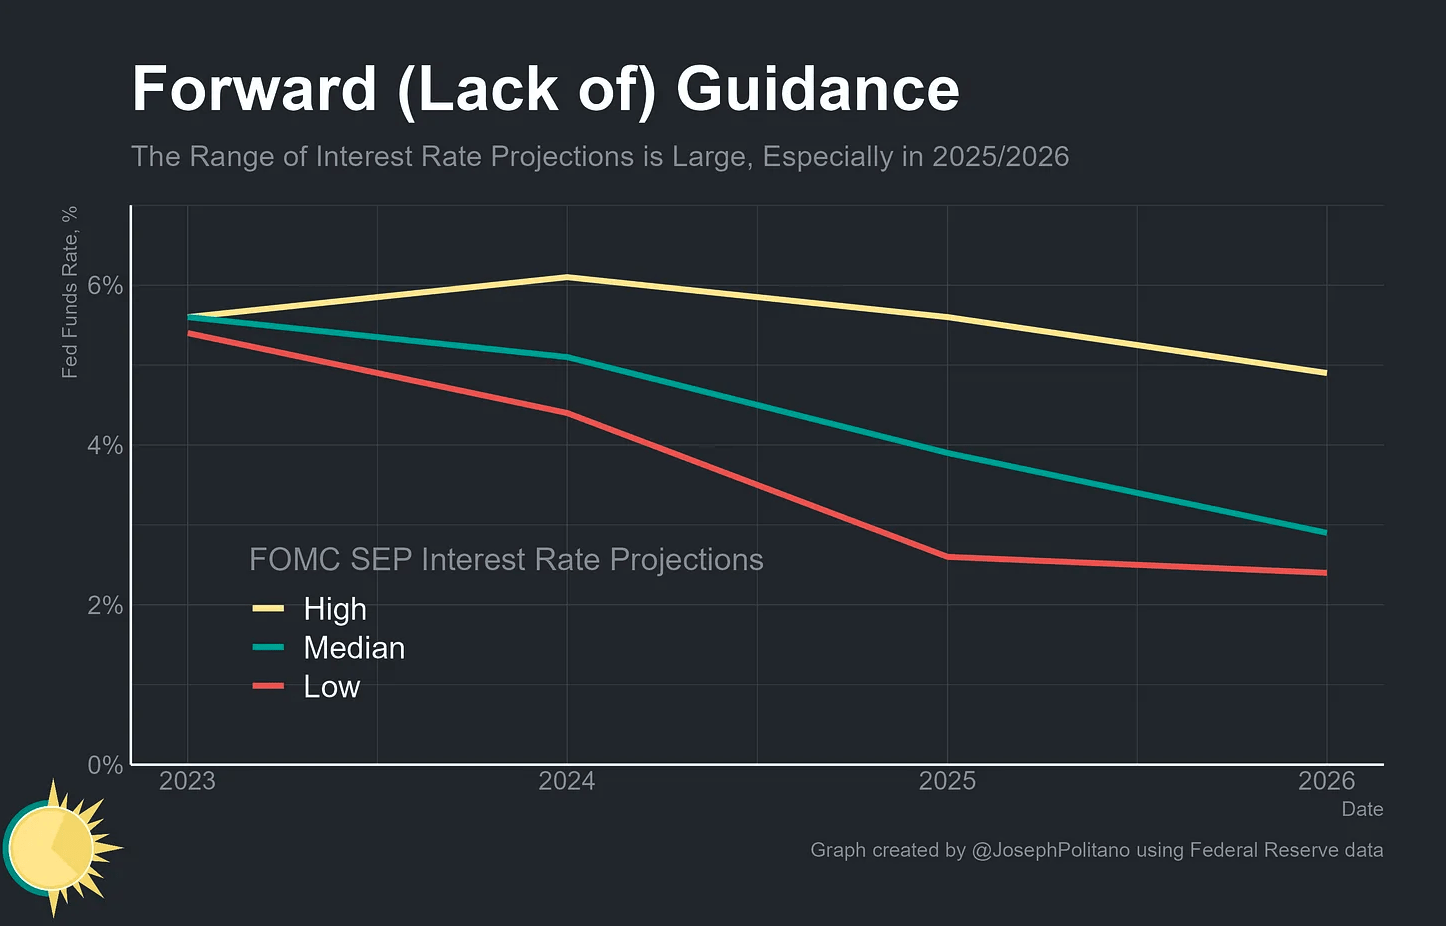
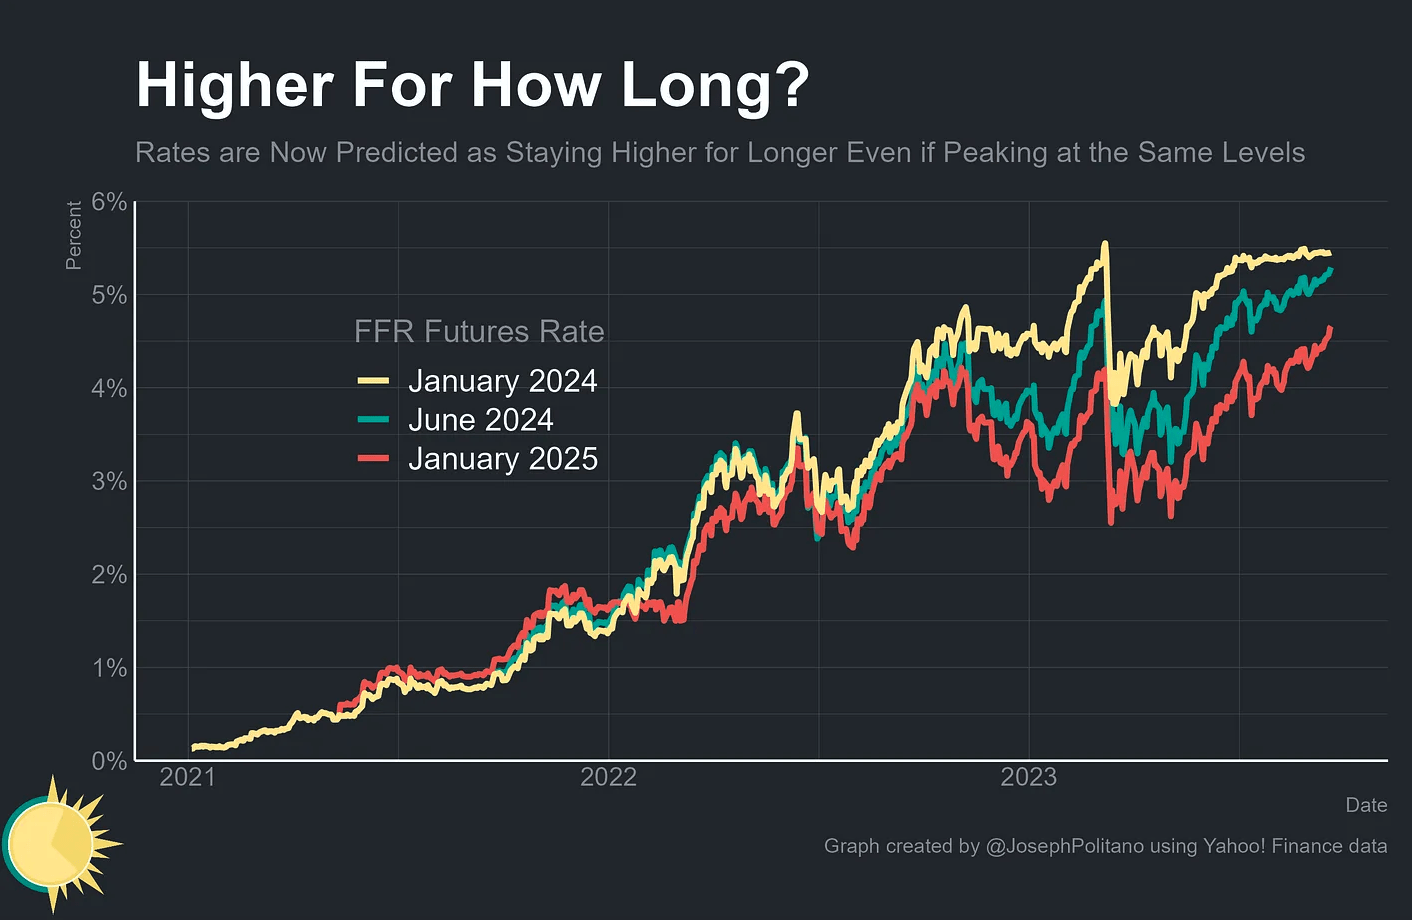
This week the Fed held rates steady now implying a recession is not necessary to stop inflation. However, the latest charts indicate that rates will remain higher for longer. The average Fed member is now projecting interest rates declining slightly to 5.1% at the end of 2024. The good news this week is greater certainty about the direction. The bad news is there is a wide range of opinions on those interest rate projections, about 3% difference between a FFR high of 5.5% and low of 2.5%. This past Spring these rates were still a shock to the market. Buyers and sellers are getting used to the “new normal” of rates above 6% and the steady drumbeat of “you can always refinance later” is prompting some buyers to get off the sofa.
Thoughts from our Monday Agent Meeting
Rentals. The market for rental properties is still seasonal in New Canaan with about 50% of all rentals turning over during the summer months. The price we ask in May is not the price we can ask in October. There are 32 rentals in New Canaan now, 14 came on in September. How many closed this past year? Oct=11, Nov=11, Dec=6, Jan=5, Feb=7, Mar=9, Apr=9, May=15, Jun=16, Jul=18, Aug=19, Sep=11 (so far). That’s 8 per month in Fall, Winter & Spring rising to 17 per month in Summer. Not a disaster if you’ve missed the market, but time to adjust expectations.
Softening. I have 4 pieces of data for my sellers. First, we are entering a seasonally slow part of the market. The Fall Market is historically half as long and half as productive as the Spring Market. Second, we are in a different rate environment. When you listed in May jumbo rates were 6.36%, by June they were 6.67% and now jumbos are 7.5%. Third, existing listings are dropping price and new listings have been constant in July and August and September at 21 per month. There are 70 single family homes on the market, about the same as February and March. Fourth, staging has really helped. We saw a major increase in traffic and more offers once you staged the house professionally. I estimate most buyers punish a house that needs work by more than 10% and they pay 5% more for a house that presents perfectly. That’s an over-generalization, but well-priced, well-staged houses are still moving in the first 30 days.
 John Engel is a Realtor with the Engel Team at Douglas Elliman and is our new Real Estate Editor. He moved to New Canaan along with Coach Lou Marinelli in 1980. John’s mother Susan Engel started her real estate career in 1983 at Mabel Lamb Inc. and when that firm was sold to Coldwell Banker she moved to Brotherhood & Higley. John joined Susan at B&H in 2008, a notoriously bad year to decide to become a Realtor. Melissa Engel joined them in 2018 forming The Engel Team. Call him @ 203-247-4700