
By John Engel
A graph of the last ten years of home sales in New Canaan shows 3,262 sales, 326 in a “normal” year, 4.38% of the roughly 7,434 housing units. By the standards of the last 50 years, 4.3% is the average turnover. In the last decade, the low was 243 sales in 2015 and 2016 and the peak was 532 sales in 2021, giving us an average of 297. But what’s “normal” about the last 10 years?
In that span, we see roughly three years of the market pre-Covid, three years of Covid, and then three years post-Covid. Covid lasted three years? According to the CDC, the pandemic began on Jan. 21, 2020, and ended on May 11, 2023. But for real-estate purposes, we can’t stop in May, without the results of the Spring Market. People are still listing and offering in May, and those sales don’t close until July. So we chose Labor Day 2023 as the inflection point when Covid stopped, and we moved on to a post-Covid market.
The three years before Covid were a bad market, the end of a ten-year slide. It’s hard to remember what it was like back then, but I remember telling clients, “It doesn’t matter if you reduce the asking price of your house because nobody is listening.” I know that markets are neither good nor bad, they just are. For every seller unable to sell, there’s a buyer getting a good deal, right? No. It’s a bad market when demand evaporates and home prices decline. That good deal isn’t good a year or two later.
The three years before Covid, 2017–2019, were a time when we peaked with 351 houses for sale in June 2019. That’s more than an entire year’s worth of inventory for sale. By contrast, this month we have only 10% of that available, 35 single family homes, representing 2.2 months of inventory. June 2019 was the tail-end of a 10-year malaise that began with the Great Financial Crisis (in January 2009, zero houses were sold in New Canaan) that we never recovered from.
What happened to real estate during Covid (2020–2022) has been well-documented. Demand for single-family homes (with open space), mostly from New York City, caused prices to rise and the volume of transactions peaked at 532 in 2020. It took two more years before the dust settled and we couldn’t point at the crisis any longer to blame it for rising prices.
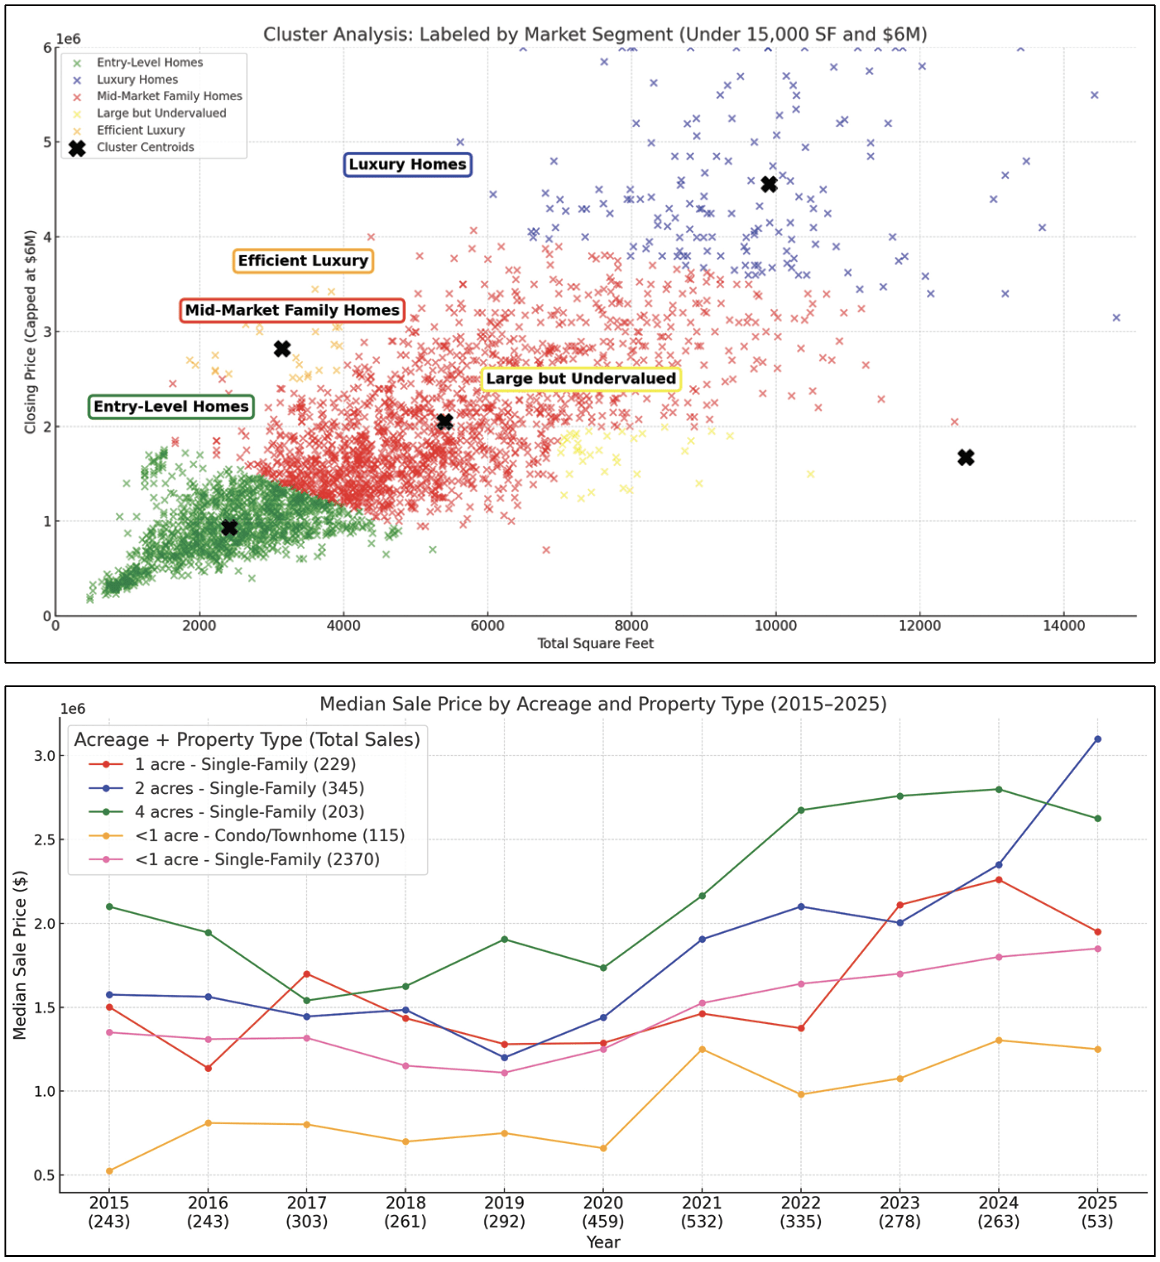
On the second graph, we’ve mapped New Canaan by sales in the 4-acre zone, 2-acre zone, 1-acre zone, and Under-1-acre Zone. Some in Hartford think New Canaan is all 4-acre zoning, but that represents only 6% to 13% of sales. It was the 4-acre zone that benefitted most from the crisis; the least valuable zone became the most valuable. Distance from town, and its impact on commute, was a major factor before Covid, and as you can see in the graph, what was a liability quickly became an asset, a condition that has persisted.
Yesterday, I was asked for a price-opinion on Barnegat Road. You can’t get more north than Barnegat Road, and I estimated a value of more than $3.5 million. The edge of town has lost none of her luster.
That brings us to today, “post-Covid,” during which, according to the graph, the 4-acre zone is valuable but slowing down, overtaken by a continued surge in value in the 1-acre and 2-acre zones that began in 2020.
Why? Who is buying, where, and for what reason, and how have patterns changed? Can we extrapolate from purchase decisions what are buyers’ prevalent primary and secondary motivations?
• Pre-Covid – lower prices across the board, South led in volume with more compact lots — 1 acre, half the average sale in East or West.
• During Covid – spike in pricing and lot size, especially West (up $200k compared to East and up $700k compared to South).
• Post-Covid – prices surged; acreage increased. West surged to $2.58m avg., while East has climbed steadily to $2m avg. South held volume and gained $500k on avg. since pre-Covid. Sales in the 4-acre zone increased, reflecting a sustained preference for privacy and scale, even as overall volume dropped.
• Entry-Level Homes – demand stayed strong, but prices surged, likely due to inventory compression and millennial demand.
• Mid-Market Family Homes – largest volume segment, the Stable Middle – buyers still competing here but fewer listings and upward price pressure.
• Efficient Luxury – smallest volume, 2–14 sales per year, these are design-led, location-prime homes – mostly new builds and top-tier renovations, $700+ psf.
• Luxury Homes – volume increased, avg. prices $5m, over 7000 sq. ft., but price per foot didn’t spike, suggesting buyers prioritize space over finishes. These are estate buyers and relocation executives.
• Large but Undervalued – homes over 6000 sq. ft. but under $450 per sq. ft. Volume was steady, but post-Covid expectations rose. These are dated homes on good land, an opportunity for value-add investors or luxury flippers.
Yard size. The trend is both economic, time, and training. In uncertain times, people say, “I don’t want to maintain that much yard” and they opt for a smaller house on a smaller lot — just not too small. When my grandfather had 4 acres on North Wilton Road in the 1970’s, he mowed his own lawn. Now, when so few of us do, is it any wonder that landscaping costs are a major factor when thinking about your next home? Landscaping takes time, and who has enough of that?
Neighborhood. We looked at South, West, and East school districts. There is no best zone, no preferred neighborhood. If you ask somebody in Darien where is wealth concentrated, the answer is Tokeneke. But in New Canaan, you’ll find expensive homes in any neighborhood, every school district. However, the graph shows us that West outshone South and East in the last few years, strange because the commute was never less of a factor than during Covid and the five years since. Trying to account for increasing sales of more expensive homes in the West, I discovered that the median home sale in West (1973) is 5 years newer than those in the East (1968), and about 3 years newer than those in the South (1970). There it is, anyway, an almost useless fact.
What the Graphs Actually Show
So, what does ten years of sales data really reveal?
• The 2-acre zone now commands a higher median price than the 4-acre zone, surpassing $3.2 million.
• Luxury condos emerged as a serious segment, jumping from $400 per sq. ft. to over $1,100 per sq. ft. at the peak, then settling just below $800 per sq. ft. as inventory tightened.
• The 4-acre zone surged during Covid — but has since been overtaken by smaller lots in better proximity.
• The 1- and 2-acre zones have shown the most consistent price growth, suggesting buyers are choosing properties that offer a balance between scale and manageability.
This isn’t just about which area “won;” it’s about changing preferences. Buyers aren’t chasing the biggest house or the lowest price. They’re choosing homes that are easier to live in, easier to maintain, and more flexible in their appeal.
That’s the value of ten years of data: not just what sold, but why.

John Engel is a broker on The Engel Team at Douglas Elliman, and he planted 5,000 daffodils for Melissa’s birthday. Apparently, the Garden Club loves Irwin Park more. Each spring, over 50,000 daffodils blanket the Great Lawn to create a breathtaking display. Our New Canaan Garden Club is one of the oldest in the nation. If you love daffodils in Irwin Park, consider making a donation to Friends of Irwin Park to support restoration projects, native plantings, and ongoing conservation efforts.