
Low inventory is only the starting point. The Hotness Index asks which markets are hot, and why.
By John Engel
When a house “just like yours” sells for a million dollars over asking on the first weekend, the instinct is to take that result to the bank. But one big sale does not make a market hot. To count as real heat, it must be happening now, for more than a month, and across more than the top end of the market.
The Hotness Index uses a dozen inputs across three scales: tightness, activity, and value. It uses both March and first-quarter data so one noisy month does not distort the picture, and it uses price per square foot alongside median price, so a few large sales do not hijack the read.
Too often, headlines capture a few blockbuster sales or a sharp rise in median price and assume the whole market is hot. But if sales volume is falling and days on market are rising, that conclusion may be wrong. A hot market needs velocity and scarcity, not just rising prices.
8.3 Darien: Exceptionally hot, but not exploding
Darien was brutally tight. Months supply was 1.3. That is an extraordinary number. DOM was 33 days, pending sales rose 26.9%, price per square foot rose 10.7%, and YTD median price was up 20.8%. But momentum is weaker than the scarcity numbers suggest. Closed sales fell 23.1% for the month and 26.7% YTD. That’s the tension in Darien. It’s hot because supply is so low and buyers are still there. It’s not exploding because closing volume is not confirming the same surge.
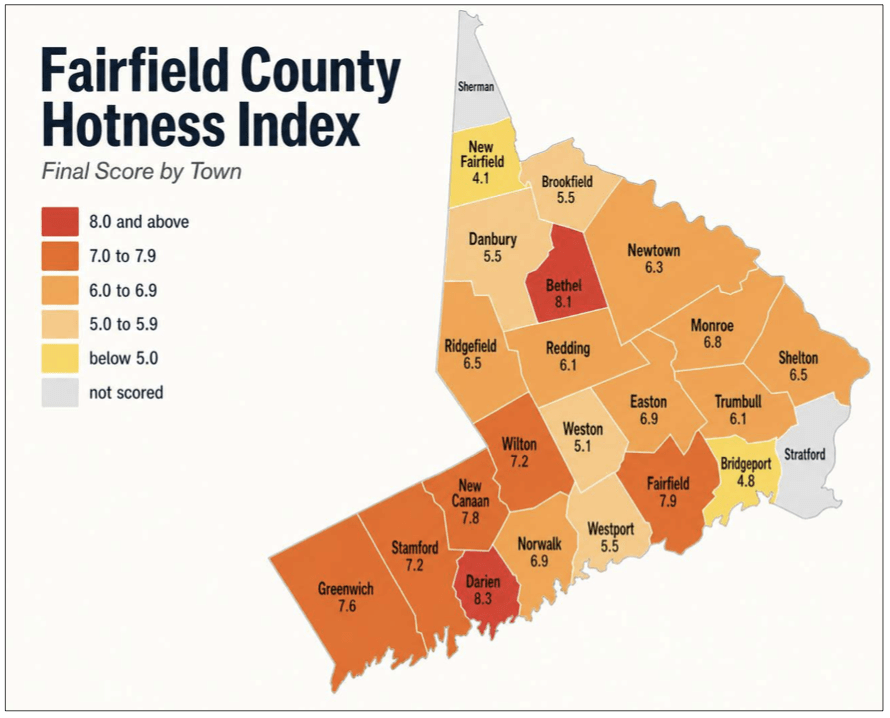
7.9 Fairfield: Hot
Fairfield is hot. Months supply fell to 1.8, inventory was down 17.1%, pending sales rose 11.4%, and closed sales rose 20.6%. Prices backed it up. Median price rose 5.5% and average price rose 17.5%. But this was not one of those markets where everything screamed. Days on market rose 5.3%, and that kept Fairfield just below the top slot. Still, this is a real seller’s market, balanced and healthy with real momentum, not a thin market living off one or two headline sales.
7.8 New Canaan: Hot
New Canaan still looks like one of the hottest markets in Fairfield County. Months supply was 1.5, inventory fell 39.5%, pending sales rose 33.3%, closed sales jumped 70%, median price rose 14%, and average price rose 35.8%. But the momentum story is not perfect. Days on market rose 140% to 72 days, which is a real drag. Even so, the combination of scarcity, price strength, and sales momentum still puts New Canaan near the top.
7.6 Greenwich: Hot, active, faster, but not scarce enough to lead
Greenwich looked active and much faster than a year ago. Closed sales rose 52.6%, DOM fell 31.6% to 13 days, and price per square foot rose 18.3%. But months’ supply was still 3.2, active inventory was 92, and median price fell 33.8%. That is why Greenwich reads more mixed than truly hot.
7.2 Wilton: Tight, but mixed
On the March numbers, Wilton was extremely tight. Months supply was 1.3, inventory was down 38.9% and yet despite that, closed sales rose 150% and sellers got 111.4% of list price. But March was mixed on price and speed. Pending sales fell 9.1%, median price fell 14.1%, average price fell 27%, and days on market rose 83.9%. The first-quarter numbers were better than March alone. YTD median price was up 11.4% and YTD closed sales were up 8.3%, although YTD DOM was still 58. So, Wilton reads as a very tight market with a choppy March disrupting a strong first quarter.
7.2 Stamford: Constrained, but softer on demand
Stamford was tight on supply. Months supply was 1.4, inventory was down 31%, and YTD median price was up 12.7%. But demand was softer than a truly hot market should show. Pending sales fell 23.1%, closed sales fell 46.7%, days on market rose 32.4%, and median price slipped 0.2%. That is why Stamford reads constrained and competitive but not roaring yet.
6.9 Norwalk: Constrained and slower
On the March numbers, Norwalk was still tight. Months supply was 1.6, inventory was down 15.4%, median price rose 7.2%, and average price rose 2.5%. But the market was clearly losing momentum. Pending sales fell 16.2%, closed sales fell 36.4%, and days on market rose 84.6% to 48 days, up from about 26 a year earlier. The first-quarter numbers did not really rescue it. YTD median price was up 12.7%, but YTD pending sales were down 9.3%, YTD closed sales were down 16.7%, and YTD DOM was still 40 days. So, Norwalk still looks constrained, but both March and the first quarter say the same thing: slower, softer activity is keeping it out of the hotter tier.
6.9 Easton: High score, low confidence
On the March numbers, Easton looked strong. Median price rose 56.5%, average price rose 31%, and days on market fell to 14 days. But the market was paper-thin. There were only two sales, pending sales fell 37.5%, closed sales fell 60%, inventory rose 40%, and months’ supply rose to 2.8. The first-quarter numbers were less dramatic, but they did not really confirm the March spike. YTD median price was up 11.6%, but YTD pending sales were down 25%, YTD closed sales were down 7.7%, and YTD DOM was 39 days. So, Easton scores well on price, but the confidence is low because the market depth is not there.
6.5 Ridgefield: Strong, but slower
On the March numbers, Ridgefield had a lot going for it. Months supply was 1.5, inventory was down 17.6%, pending sales rose 15.8%, closed sales rose 25%, and median price rose 27.6%. But March was much slower than those numbers suggest. Days on market rose 135.1% to 87 days, up from about 37 a year earlier, and average price rose only 6%, which suggests the price strength was not broad across the whole market. The first-quarter numbers were steadier, but less dramatic. YTD closed sales were up 32.1%, while YTD median price was up only 0.8%, and YTD DOM was still 56 days. So Ridgefield reads as a market with real sales momentum, but weaker price momentum and slower movement than the hottest towns.
5.5 Westport: Tight, but mixed
Westport tightened up, and the sales numbers improved. Months supply was 2.3, inventory was down 23.1%, pending sales rose 7.7%, and closed sales rose 23.5%. But the price story was weak in both March and the first quarter. The March median price fell 30.6%, and the first-quarter median was down 14.4%. Speed also softened, with days on market up 40.7% for the month and YTD DOM at 51. That is why Westport reads mixed rather than truly hot.
5.1 Weston: Tight, but weak
On the March numbers, Weston was tight. Months supply was 1.6 and inventory was down 41.4%. But almost everything else was weak. Closed sales fell 33.3%, days on market rose 112.8% to 83 days, median price fell 46.4%, and average price fell 38.7%. The first-quarter numbers were no better. YTD median price was down 10.3%, YTD pending sales were down 19%, YTD closed sales were down 50%, and YTD DOM was 72 days. So, Weston reads as a market where scarcity is real, but demand, speed, and price all point the wrong way.
2.8 Palm Beach: Expensive, active, but loose
On the March numbers, Palm Beach had some flashy headlines. Median sold price rose 38.1% month over month, sales rose to 49 from 25 in February, and new listing price per square foot rose 19.7%. But the structure of the market was weak. Months supply was 14.19, DOM was 92 days, sold-to-list was just 92%, active listings rose to 440 from 402, and estimated value was down 20.9% year over year. So, Palm Beach read as expensive and active, but not hot. The market had motion, but not scarcity.
If I’m a seller, the Hotness Index tells me not to confuse low inventory with automatic leverage. Some Fairfield County towns are still genuinely hot. In those markets, sellers can press harder because supply is tight, buyers are active, and value is holding up. But in other towns, the surface story is better than the underlying momentum. A market can have very little inventory and still be slowing down if days on market are rising, sales are slipping, or price gains are narrow. Sellers still have the advantage in much of this county, but the advantage is not equal everywhere, and it is not unlimited. The hotter the market, the more room you have. The more mixed the data, the more pricing, preparation, and timing still matter.
John Engel is a broker with The Engel Team at Douglas Elliman. He spends his days trying to separate signal from noise in housing data, which may be why Polymarket and Kalshi feel familiar: newer systems for turning uncertainty into a number.